Bitget: أعلى 4 من حيث حجم التداول اليومي العالمي!
الحصة السوقية لعملة البيتكوين BTC60.28%
مؤشر موسم العملات المشفرة البديلة:0(موسم البيتكوين)
BTC/USDT$94547.00 (-2.94%)مؤشر الخوف والطمع46(محايدة)
إجمالي صافي تدفق صناديق التداول الفوري للبيتكوين -$56.7M (يوم واحد)؛ -$39.2M (7 أيام).باقة هدية ترحيبية للمستخدمين الجدد بقيمة 6200 USDT.مطالبة الآن
تداول في أي وقتٍ وفي أي مكان باستخدام تطبيق Bitget. التنزيل الآن

متعلق بالعملات
حاسبة السعر
سجل الأسعار
التنبؤ بالأسعار
التحليل الفني
دليل شراء العملات
فئات العملات المشفرة
حاسبة الربح


سعر MovementMOVE
مُدرجة
شراءعملة عرض السعر:
USD
$0.5227%4.68-1D
آخر تحديث في 2025-02-12 13:43:33(UTC+0)
القيمة السوقية:$1,254,389,759.26
القيمة السوقية المخفضة بالكامل:$1,254,389,759.26
الحجم (24 ساعة):$113,933,327.09
الحجم في 24 ساعة / حد التوفر السوقي:%9.08
24h high:$0.5578
24h low:$0.5283
All-time high:$1.45
All-time low:$0.4962
حجم التوفر المتداول:2,400,000,000 MOVE
Total supply:
10,000,000,000MOVE
معدل التداول:%24.00
Max supply:
--MOVE
العقود:
0x3073...51a3073(Ethereum)
المزيد
ما رأيك في Movement اليوم؟
ملاحظة: هذه المعلومات هي للإشارة فقط.
سعر عملة Movement اليوم
السعر الحالي لـ Movement هو 0.5227$ لكل (MOVE / USD) اليوم ويبلغ حد التوفر السوقي الحالي 1.25B$ USD. بلغ حجم التداول على مدار 24 ساعة 113.93M$ USD. وقد تم تحديث سعر MOVE إلى USD في الوقت الفعلي. Movement بلغ -4.68% خلال الـ 24 ساعة الماضية. بلغ العدد المتداول 2,400,000,000 .
ما هو أعلى سعر لعملة MOVE؟
MOVE في أعلى مستوى لها على الإطلاق (ATH) وهو 1.45$، وسُجّل في 2024-12-10.
ما أعلى سعر لعملة MOVE؟
بلغت MOVE أعلى مستوى لها على الإطلاق (ATH) وهو 0.4962$، وسُجّل في 2025-02-10.
التنبؤ بسعر Movement
متى يكون الوقت المناسب لشراء MOVE؟ هل يجب أن أشتري أو أبيع MOVE الآن؟
عند اتخاذ قرار شراء أو بيع MOVE، يجب عليك أولاً التفكير في استراتيجية التداول الخاصة بك. سيكون نشاط التداول للمتداولين على المدى الطويل والمتداولين على المدى القصير مختلفًا أيضًا. وقد يوفر لك تحليل Bitget الفني لعملة MOVE مرجعًا للتداول.
وفقًا لـ تحليل فني لمدة 4 ساعات لعملة MOVE، فإن إشارة التداول هي بيع.
وفقًا لـ تحليل فني لمدة يوم لعملة MOVE، فإن إشارة التداول هي بيع قوي.
وفقًا لـ تحليل فني لمدة أسبوع لعملة MOVE، فإن إشارة التداول هي بيع.
ماذا سيكون سعر MOVE في 2026؟
استنادًا إلى نموذج التنبؤ بأداء السعر التاريخي لـ MOVE، من المتوقع أن يصل سعر MOVE إلى $0.5364 في 2026.
ماذا سيكون سعر MOVE في 2031؟
في 2031، من المتوقع أن يرتفع سعر MOVE بمقدار %28.00+. بحلول نهاية 2031، من المتوقع أن يصل سعر MOVE إلى $1.72، مع عائد استثمار تراكمي قدره %217.34+.
سجل الأسعار عملة Movement (USD)
سعر Movement بلغ %22.76- خلال العام الماضي. كان أعلى سعر لعملة MOVE بعملة USD في العام الماضي $1.45 وأدنى سعر لـ MOVE بعملة USD في العام الماضي $0.4962.
الوقتالسعر/التغيير أقل سعرأعلى سعر
أقل سعرأعلى سعر 24h%4.68-$0.5283$0.5578
7d%18.44-$0.4962$0.6344
30d%34.44-$0.5096$0.9061
90d%22.63-$0.4962$1.45
1y%22.76-$0.4962$1.45
طوال الوقت%15.14-$0.4962(2025-02-10, أمس )$1.45(2024-12-10, منذ 64 يوم (أيام) )
معلومات السوق لعملة Movement
تاريخ حد التوفر السوقي لـ Movement
Movement السوق
Movement المقتنيات حسب التركيز
كبار المتداولين
المستثمرون
البيع بالتجزئة
Movement من العناوين حسب الوقت المحتفظ به
المالكون
الطرود
المتداولون
مخطط أسعار مباشر لأسعار coinInfo.name (12)

Movement من التقييمات
متوسط التقييمات من المجتمع
4.5
يُستخدم هذا المحتوى للأغراض المعلوماتية فقط.
MOVE إلى عملة محلية
1 MOVE إلى MXN$10.741 MOVE إلى GTQQ4.021 MOVE إلى CLP$502.561 MOVE إلى UGXSh1,913.461 MOVE إلى HNLL13.421 MOVE إلى ZARR9.631 MOVE إلى TNDد.ت1.671 MOVE إلى IQDع.د684.691 MOVE إلى TWDNT$17.171 MOVE إلى RSDдин.59.021 MOVE إلى DOP$32.431 MOVE إلى MYRRM2.341 MOVE إلى GEL₾1.461 MOVE إلى UYU$22.651 MOVE إلى MADد.م.5.231 MOVE إلى OMRر.ع.0.21 MOVE إلى AZN₼0.891 MOVE إلى SEKkr5.691 MOVE إلى KESSh67.421 MOVE إلى UAH₴21.79
- 1
- 2
- 3
- 4
- 5
آخر تحديث في 2025-02-12 13:43:33(UTC+0)
كيفية شراء Movement(MOVE)

أنشئ حسابًا مجانيًا على Bitget
سجّل اشتراكك في Bitget باستخدام عنوان بريدك الإلكتروني/رقم جوّالك وإنشاء كلمة مرور قوية لتأمين حسابك.

تحقق من حسابك
تحقق من هويتك عن طريق إدخال معلوماتك الشخصية وتحميل بطاقة هوية صالحة بها صورتك.

شراء Movement (MOVE)
استخدم مجموعة متنوعة من خيارات الدفع لشراء Movement على Bitget. سنوضح لك الطريقة.
تداول عقود MOVE الآجلة المستمرة
بعد الاشتراك بنجاح في Bitget وشراء USDT أو عملة MOVE، يمكنك بدء تداول المشتقات، بما في ذلك عقود MOVE الآجلة والتداول بالهامش لزيادة دخلك.
السعر الحالي لعملة MOVE هو 0.5227$، مع تغيير السعر لمدة 24 ساعة بنسبة %4.68-. يمكن للمتداولين الربح إما عن طريق الشراء أو البيع على عقود MOVE الآجلة.
انضم إلى تداول MOVE بالنسخ من خلال متابعة المتداولين المميزين.
بعد الاشتراك في Bitget وشراء عملات USDT أو MOVE بنجاح، يمكنك أيضًا بدء التداول بالنسخ من خلال متابعة المتداولين المميزين.
أخبار Movement

مشروع WLFI المشفر لعائلة ترامب اشترى أكثر من 800,000 عملة MOVE في الـ 45 دقيقة الماضية
Bitget•2025-02-11 01:03
مشروع العملات الرقمية لعائلة ترامب WLFI ينفق 156,667 USDC لشراء 273,937 MOVEs مرة أخرى
Bitget•2025-02-10 15:32
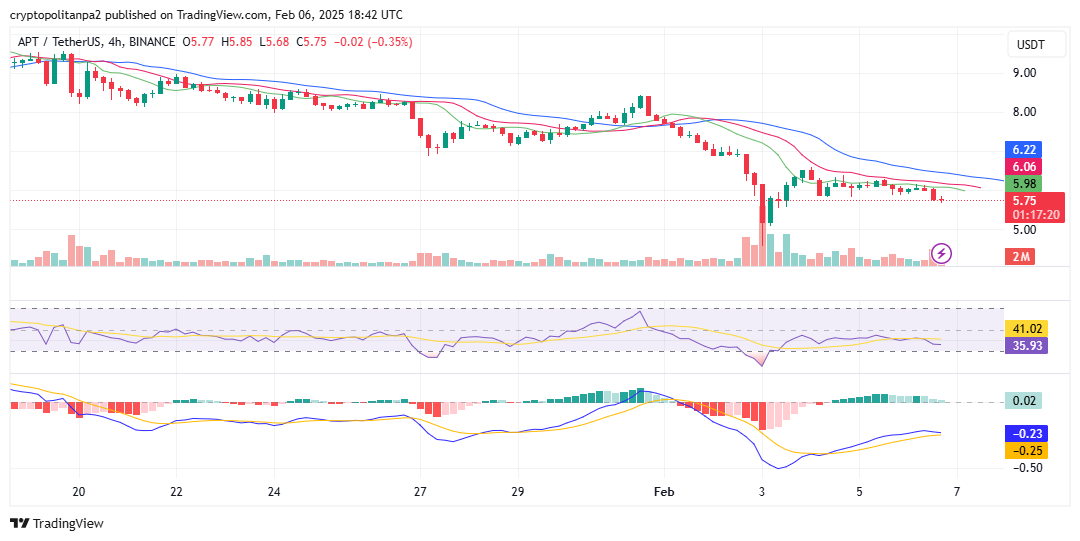
توقعات سعر Aptos للفترة 2025-2031: هل يحمل رمز APT آمالًا صعودية؟
CryptoNewsNet•2025-02-07 10:00

شراء المزيد


الأسئلة الشائعة
ما السعر الحالي لـ Movement؟
السعر المباشر لعملة Movement هو $0.52 لكل (MOVE/USD) مع حد سوقي حالي قدره $1,254,389,759.26 USD. تشهد قيمة عملة Movement لتقلبات متكررة بسبب النشاط المستمر على مدار الساعة طوال أيام الأسبوع (24/7) في سوق العملات المشفرة. تُتاح بيانات السعر الحالي في الوقت الفعلي لعملة Movement وبياناته السابقة على Bitget.
ما حجم تداول Movement على مدار 24 ساعة؟
خلال الـ 24 ساعة الماضية، حجم تداول Movement بلغ 113.93M$.
ما أعلى مستوى على الإطلاق لـ Movement؟
أعلى مستوى على الإطلاق لـ Movement هو 1.45$. هذا أعلى سعر على الإطلاق لـ Movement منذ الإصدار.
هل يمكنني شراء Movement على منصة Bitget؟
نعم، يتوفر Movement حاليًا على منصة Bitget المركزية. للحصول على إرشادات أكثر تفصيلاً، راجع دليل كيفية شراء الخاص بنا المفيد.
هل يمكنني تحقيق دخل ثابت من الاستثمار في Movement؟
بالطبع، توفر Bitget منصة تداول استراتيجية، مع برامج تداول آلية ذكية لتشغيل عمليات التداول آليًا وتحقيق الأرباح.
أين يمكنني شراء Movement بأقل رسوم؟
يسعدنا أن نعلن أن منصة تداول استراتيجية متاح الآن في منصة تداول Bitget. تقدم Bitget واحدة من أفضل رسوم التداول في المجال وتفاصيل لضمان استثمارات مربحة للمتداولين.
أين يمكنني شراء Movement (MOVE)؟
قسم الفيديو - التحقق السريع والتداول السريع!

كيفية إكمال التحقق من الهوّية على Bitget وحماية نفسك من عمليات الاحتيال
1. يُرجى تسجيل الدخول إلى حسابك في Bitget.
2. إذا كنت مستخدمًا جديدًا لمنصة Bitget، شاهد الشرح التفصيلي الخاص بنا حول كيفية إنشاء حساب.
3. مرر مؤشر الماوس فوق رمز الملف الشخصي الخاص بك، وانقر على «لم يتم التحقق منه»، واضغط على «تحقق».
4. اختر بلد الإصدار أو المنطقة ونوع الهوّية، واتبع التعليمات.
5. حدد «التحقق عبر الجوّال» أو «الكمبيوتر الشخصي» بناءً على تفضيلاتك.
6. أدخل بياناتك وأرسل نسخة من هويتك، والتقط صورة ذاتية.
7. أرسل طلبك، وبهذا تكون قد أكملت التحقق من الهوية!
استثمارات العملات المشفرة، بما في ذلك شراء Movement عبر الإنترنت عبر منصة Bitget، عرضة لمخاطر السوق. توفر لك منصة Bitget طرقًا سهلة ومريحة لشراء Movement، ونبذل قصارى جهدنا لإبلاغ مستخدمينا بشكل كامل بكل عملة مشفرة نقدمها على منصة التداول. ومع ذلك، فإننا لا نتحمل أي مسؤولية للنتائج التي قد تنشأ عن عملية شراء Movement. لا تُعد هذه الصفحة وأي معلومات متضمنة تحيزًا لأي عملة مشفرة معينة.
رؤى Bitget

KOO_Koo
7ساعة
🚀 Franklin Templeton Makes a Move!
Franklin Templeton has registered the Franklin Solana Trust in Delaware, hinting at a potential filing for a spot Solana ETF soon.
SOON%0.00
MOVE%0.00

A-Rahman-A
7ساعة
$BERA Coin 🪙(BERA/USDT) Technical 🪤
$BERA Coin (BERA/USDT) Technical Analysis – Market Outlook and Insights
Bera Coin ($BERA /USDT) is currently trading at $5.512, reflecting a slight -0.27% decline. The market exhibits notable volatility, with a 24-hour high of $6.349 and a 24-hour low of $5.213. This fluctuation highlights the dynamic nature of the asset and presents opportunities for both traders and investors.
Market Trend and Price Action
Examining the 1-hour candlestick chart, we can observe that the price experienced a strong uptrend, reaching a peak of $6.349 before undergoing a correction. The price dipped to a support level of $4.736 before recovering. Currently, it is hovering around $5.512, maintaining relative stability.
Technical Indicators Analysis
Exponential Moving Averages (EMA):
EMA (5): $5.522
EMA (10): $5.546
EMA (20): $5.546
The short-term EMA (5) is slightly below the EMA (10) and EMA (20), suggesting a possible sideways movement or mild bearish pressure in the short term.
Volume & Turnover:
The 24-hour trading volume stands at 7.71 million BERA, with a total turnover of $43.52 million USDT.
High trading volume indicates strong market participation, suggesting active interest from traders.
Support & Resistance Levels
Key Support: $5.213 (recent low)
Major Resistance: $6.349 (recent high)
Intermediate Resistance: $5.609
$BERA Coin remains in a volatile phase with strong trading activity. Short-term traders should watch for breakout confirmation, while long-term investors may find dips as good buying opportunities if market fundamentals remain strong. The coming hours will be crucial in determining the next major move for $BERA /USDT.
MOVE%0.00
MAJOR%0.00

SIRKUTA
7ساعة
$BERA
Current Trend: The market appears to be consolidating within a range. The price has been fluctuating between approximately 5.38 and 6.31.
Entry Point:
If you are looking to buy, a good entry point could be when the price is near the lower range (around 5.38 to 5.40) to enter a long position. The price is currently sitting near 5.64, which could be a point of decision depending on the market movement. If the price tests and bounces off the support (around 5.40), it could be a good opportunity to go long.
Alternatively, if the price breaks above the 0.618 Fibonacci retracement level (around 5.67), this could signal a potential move upward.
Take Profit (TP):
Based on the Fibonacci levels, a target could be the 0.786 level around 5.96 or even the 1.0 level at 6.31. These are logical resistance levels where the price could struggle to break through.
The next level beyond 6.31 would be closer to 6.50, indicated by the chart as a potential resistance point, so this could be considered a second profit-taking level if the market moves higher.
Stop-Loss (SL):
To limit risk, the stop-loss could be set just below the support level, around 5.38 to 5.40. This is because if the price breaks below these levels, the market might go into a downtrend, invalidating the long position.
A more conservative stop-loss could be around 5.50 if you prefer to allow some fluctuations within the range, but it would increase your risk slightly.
Indicators:
The EMA (50) is at 5.65, and the EMA (100) is at 6.27. This shows that the price is still below the 100-period EMA, indicating a bearish sentiment overall.
The MACD is showing a slight negative divergence, but with a potential to cross upwards if the price bounces, giving a short-term bullish signal.
The Stochastic RSI is indicating a slightly overbought condition (with the %K at 50.34 and the %D at 75.21). A potential short-term pullback might occur, so monitoring this indicator closely will be important.
Conclusion:
Entry: Around 5.40 to 5.50 for a long position.
Take Profit: Target around 5.96 and then 6.31.
Stop-Loss: Set below 5.38 for safety.
MOVE%0.00
NEAR%0.00

Jack*Liam
8ساعة
$LAYER is showing strong bullish momentum, with a current price of $0.8680, a significant 334% increase. Several indicators point towards a potential breakout:
* Price Momentum: The substantial price increase suggests strong buying pressure.
* Volume: "Surging" volume reinforces the bullish sentiment, indicating increased market participation.
* Moving Average Crossover: A confirmed MA crossover often signals the start of a new uptrend.
* Stochastic RSI: A high Stoch RSI of 89.48 suggests strong momentum, although it could also indicate overbought conditions.
Potential Price Targets:
* Short-term: If the price can hold above $0.90, a move towards $1.00 is likely.
* Mid-term: Whale activity above $1.00 could propel the price towards $1.50.
Important Note: While these indicators are positive, it's crucial to remember that the cryptocurrency market is highly volatile. A high Stoch RSI can sometimes indicate an overbought situation, which could lead to a price correction. Always exercise caution and manage your risk accordingly.
HOLD%0.00
MOVE%0.00

BGUSER-BNELE6M5
8ساعة
$BERA Coin 1H Chart Analysis: Trend, Technicals & Price Action
Current Market Overview
$BERA Coin is currently trading at $5.529, up +4.64%, showing positive momentum. The price is hovering near a key resistance zone while maintaining strong support levels, which could indicate a breakout or consolidation phase.
Technical Analysis
1️⃣Support & Resistance Levels
Support Level: $4.724 – This has acted as a strong demand zone where buyers stepped in.
Resistance Zone: $5.446 - $6.000 – Price has faced multiple rejections in this area.
If Bera Coin manages to break above $6.000, it could trigger further bullish momentum.
2️⃣ Trend Analysis
Short-Term Trend: The price has been moving in a sideways range after a downward correction, showing signs of accumulation.
Medium-Term Trend: A potential reversal is forming as the price retests resistance after bouncing from support.
3️⃣Price Action Insights
The price has tested the resistance zone multiple times,forming a potential breakout structure.
Higher lows indicate strength and a breakout above $6.000 could lead to a move towards $7.000 - $7.500.
If rejected,the price might retrace back to the $5.000 - $4.724 support range before attempting another breakout.
Bullish & Bearish Scenarios
✅ Bullish Case
A breakout above $6.000 could push prices towards $7.000 - $7.500.
Volume increase would confirm buying pressure.
Strong price action near support levels signals accumulation.
❌ Bearish Case
If the price fails to break resistance,it could retest the $5.000 - $4.724 support zone.
A breakdown below $4.724 could invalidate the bullish setup and trigger a bearish move towards $4.500 or lower.
MOVE%0.00
UP%0.00
الأصول ذات الصلة
العملات المشفرة المعروفة
مجموعة مختارة من أفضل 8 عملة مشفرة حسب القيمة السوقية.


المُضاف حديثًا
أحدث العملات المشفرة المضافة.


حد التوفر السوقي القابل للمقارنة
ومن بين جميع أصول Bitget، فإن هذه الأصول الـ 8 هي الأقرب إلى Movement من حيث القيمة السوقية.


