Bitget App
Trade smarter
Buy cryptoMarketsTradeFuturesBotsEarnCopy
FTX Users' Debt price

FTX Users' Debt priceFUD

focusIcon
subscribe
Not listed
Quote currency:
USD
Data is sourced from third-party providers. This page and the information provided do not endorse any specific cryptocurrency. Want to trade listed coins?  Click here

How do you feel about FTX Users' Debt today?

IconGoodGoodIconBadBad
Note: This information is for reference only.

Price of FTX Users' Debt today

The live price of FTX Users' Debt is $9.62 per (FUD / USD) today with a current market cap of $0.00 USD. The 24-hour trading volume is $0.00 USD. FUD to USD price is updated in real time. FTX Users' Debt is 0.01% in the last 24 hours. It has a circulating supply of 0 .

What is the highest price of FUD?

FUD has an all-time high (ATH) of $80.11, recorded on 2023-02-07.

What is the lowest price of FUD?

FUD has an all-time low (ATL) of $5.71, recorded on 2023-03-02.
Calculate FTX Users' Debt profit

FTX Users' Debt price prediction

What will the price of FUD be in 2026?

Based on FUD's historical price performance prediction model, the price of FUD is projected to reach $10.42 in 2026.

What will the price of FUD be in 2031?

In 2031, the FUD price is expected to change by +22.00%. By the end of 2031, the FUD price is projected to reach $20.9, with a cumulative ROI of +117.22%.

FTX Users' Debt price history (USD)

The price of FTX Users' Debt is -11.17% over the last year. The highest price of in USD in the last year was $16.17 and the lowest price of in USD in the last year was $9.4.
TimePrice change (%)Price change (%)Lowest priceThe lowest price of {0} in the corresponding time period.Highest price Highest price
24h+0.01%$9.62$9.63
7d+0.02%$9.62$9.63
30d+0.10%$9.61$10.43
90d-4.52%$9.6$10.71
1y-11.17%$9.4$16.17
All-time-86.30%$5.71(2023-03-02, 2 years ago )$80.11(2023-02-07, 2 years ago )

FTX Users' Debt market information

FTX Users' Debt's market cap history

Market cap
--
Fully diluted market cap
--
Market rankings
Buy crypto

FTX Users' Debt holdings by concentration

Whales
Investors
Retail

FTX Users' Debt addresses by time held

Holders
Cruisers
Traders
Live coinInfo.name (12) price chart
loading

FTX Users' Debt ratings

Average ratings from the community
4.4
100 ratings
This content is for informational purposes only.

About FTX Users' Debt (FUD)

The Historical Significance and Key Features of Cryptocurrencies

Cryptocurrencies have revolutionized the financial world and have created a new monetary paradigm that is digital, decentralized, and borderless. This article aims to highlight their historical significance and key features.

Historical Significance of Cryptocurrencies

Cryptocurrencies, especially the pioneering Bitcoin, emerged in the aftermath of the 2008 financial crisis. An individual, or a group of individuals, under the pseudonym Satoshi Nakamoto, designed Bitcoin as a response to the perceived failure of central banks and traditional banking systems. It was a slap on the face of modern monetary theory, proposing a shift from trust-based, centrally administered systems to a trustless and decentralized system.

Since Bitcoin's introduction, the cryptocurrency market has rapidly expanded. Many alternative cryptocurrencies (altcoins) entered the market, with each bearing its unique features. Cryptocurrencies have been adopted for extensive online transactions, investment ventures, and even as a means to fundraise for projects (Initial Coin Offerings). They have slowly permeated traditional financial systems, highlighting their historical significance. For instance, consider BGB, an anonymous, safe, and fast transaction-enabling cryptocurrency that has gained popularity over the years.

Key Features of Cryptocurrencies

  1. Decentralization

Cryptocurrencies are decentralized, implying they are not controlled by any central authority like a government or financial institution. Instead, cryptocurrencies are managed through distributed ledger technologies, such as blockchain.

  1. Anonymity Privacy

Cryptocurrency transactions offer a high level of anonymity and privacy. While all transactions are visible in the blockchain, identities are masked, promoting privacy.

  1. Transparency

Simultaneously offering anonymity and transparency might seem contradictory, but such is the profoundness of cryptocurrencies. Every cryptocurrency transaction is logged onto the blockchain, making it publicly visible and hard to alter, promoting transparency.

  1. Security

Cryptocurrencies are considered secure due to the cryptographic technology they utilize. This makes them immune to counterfeiting and fraud, which is frequently associated with traditional banking systems.

  1. Speed and Accessibility

Cryptocurrency transactions are rapid and can be made anytime, anywhere, as long as there is internet access.

  1. Inflation Resistant

Most cryptocurrencies, like Bitcoin and BGB, have a cap on the total number of coins that can exist. This helps in reducing the problem of inflation that plagues traditional fiat currencies.

Conclusion

The rise of cryptocurrencies marks a significant shift in our conception and handling of money. These digital assets have inherent features like decentralization, privacy, transparency, security, speed, and inflation resistance that make them a fascinating alternative to traditional monetary systems. Although they face challenges like regulatory scrutiny and market volatility, the historical significance of cryptocurrencies cannot be overlooked as innovation in the finance arena and emancipation from traditional banking systems continues to unfold.

FTX Users' Debt news

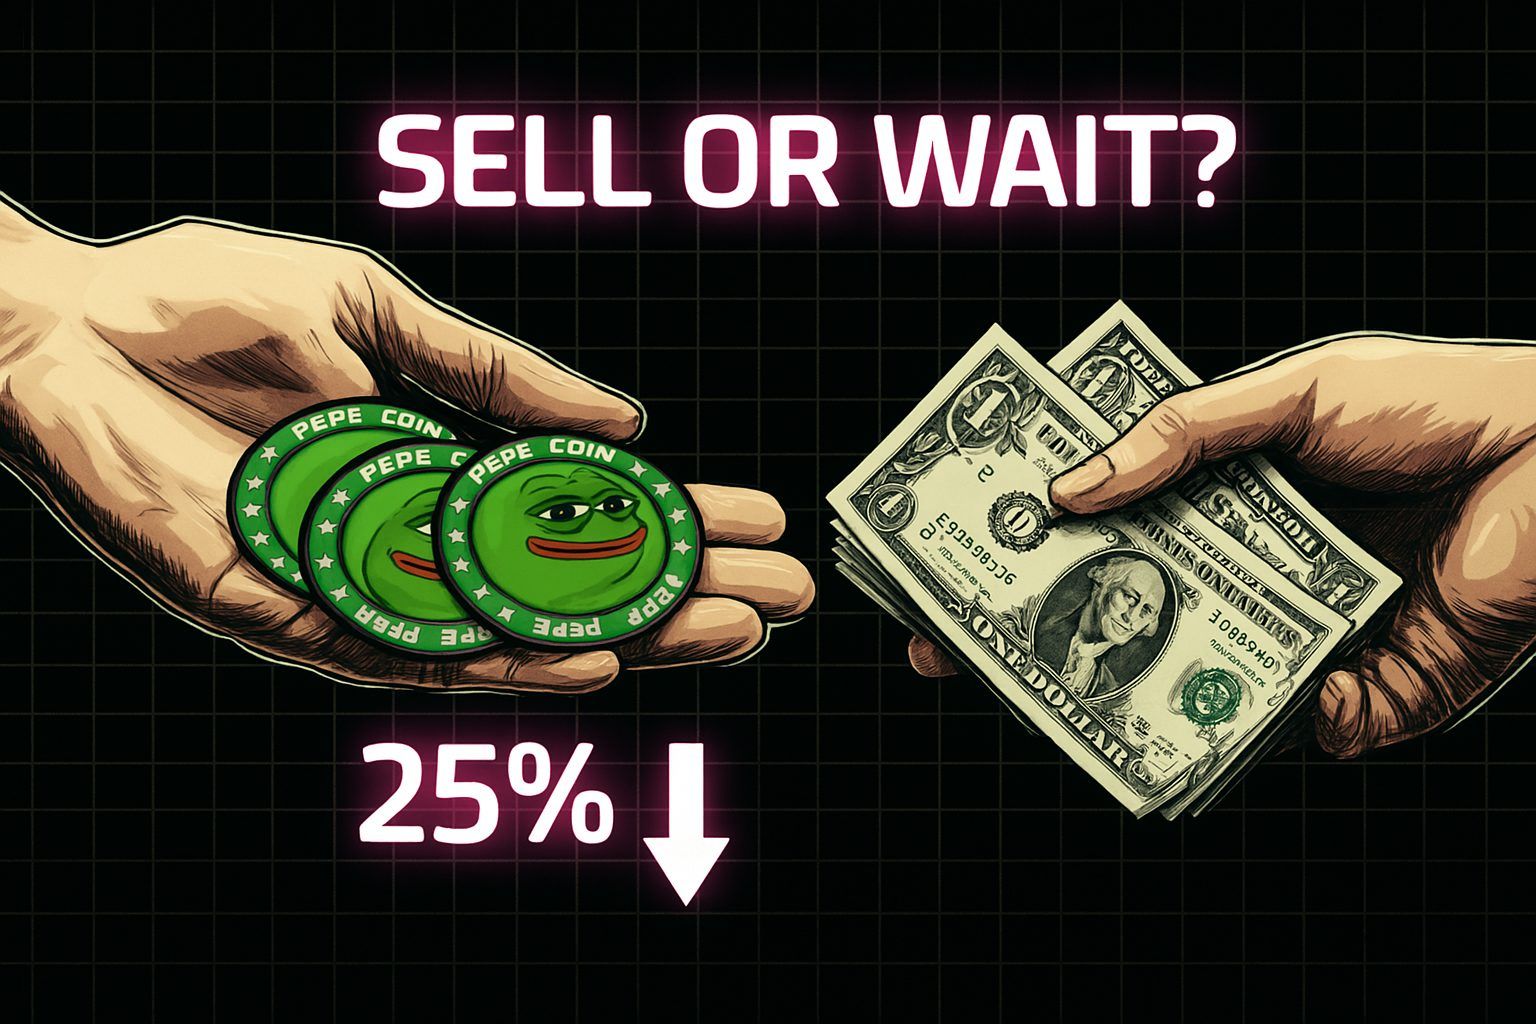
PEPE Just Collapsed 25% in 5 Days – Should You Sell Now or Buy the Dip?

While some speculators may be quick to rule out Pepe after a poor weekly performance, this could be a major “buy-the-dip” opportunity in disguise.


CryptoNews2025-04-01 23:11
BTC Price Stuck Under $85K: A Consequence Of Trump’s Tariff War?

BTC remains below $85K since a massive set of options expired on March 28th, 2025. Tariff wars are escalating steadily with the U.S. adamant on its reciprocal tariffs stance. Is $85,000 the maximum pain point?

TheCoinRepublic2025-03-31 19:12
More FTX Users' Debt updates

FAQ

What is the current price of FTX Users' Debt?

The live price of FTX Users' Debt is $9.62 per (FUD/USD) with a current market cap of $0 USD. FTX Users' Debt's value undergoes frequent fluctuations due to the continuous 24/7 activity in the crypto market. FTX Users' Debt's current price in real-time and its historical data is available on Bitget.

What is the 24 hour trading volume of FTX Users' Debt?

Over the last 24 hours, the trading volume of FTX Users' Debt is $0.00.

What is the all-time high of FTX Users' Debt?

The all-time high of FTX Users' Debt is $80.11. This all-time high is highest price for FTX Users' Debt since it was launched.

Can I buy FTX Users' Debt on Bitget?

Yes, FTX Users' Debt is currently available on Bitget’s centralized exchange. For more detailed instructions, check out our helpful How to buy guide.

Can I get a steady income from investing in FTX Users' Debt?

Of course, Bitget provides a strategic trading platform, with intelligent trading bots to automate your trades and earn profits.

Where can I buy FTX Users' Debt with the lowest fee?

Bitget offers industry-leading trading fees and depth to ensure profitable investments for traders. You can trade on the Bitget exchange.

Where can I buy crypto?

Buy crypto on the Bitget app
Sign up within minutes to purchase crypto via credit card or bank transfer.
Download Bitget APP on Google PlayDownload Bitget APP on AppStore
Trade on Bitget
Deposit your cryptocurrencies to Bitget and enjoy high liquidity and low trading fees.

Video section — quick verification, quick trading

play cover
How to complete identity verification on Bitget and protect yourself from fraud
1. Log in to your Bitget account.
2. If you're new to Bitget, watch our tutorial on how to create an account.
3. Hover over your profile icon, click on “Unverified”, and hit “Verify”.
4. Choose your issuing country or region and ID type, and follow the instructions.
5. Select “Mobile Verification” or “PC” based on your preference.
6. Enter your details, submit a copy of your ID, and take a selfie.
7. Submit your application, and voila, you've completed identity verification!
Cryptocurrency investments, including buying FTX Users' Debt online via Bitget, are subject to market risk. Bitget provides easy and convenient ways for you to buy FTX Users' Debt, and we try our best to fully inform our users about each cryptocurrency we offer on the exchange. However, we are not responsible for the results that may arise from your FTX Users' Debt purchase. This page and any information included are not an endorsement of any particular cryptocurrency. Any price and other information on this page is collected from the public internet and can not be consider as an offer from Bitget.

FUD resources

Bitget Insights

muphy
muphy
5h
Bullish or Bearish? What’s Next for $IMT’s Trading Plan?
$IMT has officially launched on Bitget, opening the door to increased liquidity and investor interest. However, traders are now asking the crucial question: Is $IMT poised for a bullish run, or should we expect a bearish correction? Let’s break this down using fundamental and technical analysis, along with market sentiment indicators. 1. Technical Analysis: Key Indicators to Watch Support & Resistance Levels Identifying key resistance and support levels is critical for predicting $IMT’s next move. If $IMT holds above its support zone, it may attract more buyers, reinforcing a bullish trend. Conversely, if it struggles near resistance and faces heavy sell-offs, it could indicate a bearish reversal. Moving Averages (MA) The 50-day moving average (MA) is a key short-term trend indicator. If $IMT’s price remains above the 50-day MA, it signals a bullish trend. However, a break below the 50-day MA might indicate a bearish phase. Relative Strength Index (RSI) & MACD RSI Above 70: $IMT could be overbought, increasing the likelihood of a correction. RSI Below 30: The token may be oversold, signaling a potential buying opportunity. MACD Crossover: If the MACD line crosses above the signal line, it confirms bullish momentum. A bearish crossover suggests potential downside. 2. Market Sentiment & On-Chain Activity Whale Movements & Smart Money Activity Large buys from whales indicate strong confidence in $IMT, supporting a bullish case. If whales start selling, it may trigger a broader market correction. Trading Volume & Liquidity on Bitget Higher trading volume means increased interest and liquidity, which is typically bullish. A sudden drop in volume may suggest that interest is fading, leading to price stagnation or decline. Community & Social Media Buzz If $IMT trends positively on crypto forums, Twitter, and Telegram, it could attract new buyers. Negative sentiment or FUD (Fear, Uncertainty, and Doubt) might create sell pressure. 3. Fundamental Factors: What Could Influence $IMT’s Next Move? Upcoming Developments & Partnerships Any announcements regarding project updates, partnerships, or ecosystem expansion could boost investor confidence. A lack of news or delays in roadmap execution could lead to a bearish outlook. Overall Crypto Market Conditions If Bitcoin (BTC) and Ethereum (ETH) continue an uptrend, altcoins like $IMT could benefit from a bullish wave. A market-wide correction could drag $IMT down, regardless of its individual performance. Final Verdict: Bullish or Bearish? Bullish Case: If $IMT maintains strong support levels and breaks above key resistance. Increased trading volume and positive community sentiment. Bullish crossover signals in RSI and MACD indicators. Bearish Case: Failure to hold key support levels. Declining volume and interest in the token. Negative sentiment, whale sell-offs, or unfavorable market conditions. Trading Strategy Recommendation: Short-term traders: Watch RSI and MACD for entry and exit points. Long-term investors: Look for strong support levels to accumulate during dips. Risk management: Set stop-loss levels to minimize losses in case of a trend reversal. Final Thought $IMT’s price action in the coming days will depend on market sentiment, trading volume, and broader crypto trends. Traders should closely monitor key technical indicators and fundamental developments to navigate the market effectively.$IMT
BTC-0.01%
MOVE+3.28%
Smith001
Smith001
6h
$IMT’s Next Move: Bullish Breakout or Bearish Correction? With $IMT gaining traction on Bitget, traders are closely watching whether the token will continue its upward momentum (bullish breakout) or face a bearish correction. To determine the likely next move, we will analyze technical indicators, market sentiment, whale activity, and macroeconomic factors influencing $IMT’s price trajectory. 1. Technical Analysis: Key Indicators to Watch a) Support & Resistance Levels Strong Support Zone: If $IMT holds above key support levels, it suggests strong buying interest and reduces the chances of a deep correction. Major Resistance Zone: If $IMT struggles to break resistance, it may signal a price reversal or consolidation before the next move. Breakout Confirmation: A breakout above resistance with high trading volume confirms a bullish trend, while a rejection at resistance could lead to a bearish pullback. b) Moving Averages (MA) – Trend Confirmation 50-day & 200-day Moving Averages: If $IMT’s price stays above these moving averages, it signals a strong uptrend. If it falls below, a bearish trend reversal may be incoming. Golden Cross vs. Death Cross: A Golden Cross (50-day MA crossing above 200-day MA) is a bullish signal. A Death Cross (50-day MA crossing below 200-day MA) suggests a bearish trend. c) Relative Strength Index (RSI) – Overbought or Oversold? RSI above 70: Overbought conditions, suggesting a possible correction. RSI below 30: Oversold conditions, signaling a potential bounce. 💡 Verdict: If $IMT breaks key resistance with strong volume, a bullish breakout is likely. If it fails and RSI is overbought, expect a correction. 2. Market Sentiment & Social Trends: Bullish or Bearish? a) Social Media Hype & Investor Sentiment If $IMT trends on Twitter, Telegram, and Reddit, it could attract new investors, pushing prices higher. Negative sentiment or FUD (Fear, Uncertainty, Doubt) could trigger a sell-off, leading to a bearish correction. b) Exchange Listings & Partnerships More exchange listings or strategic partnerships could drive demand, fueling a bullish breakout. If no major announcements occur, trading volume may drop, leading to sideways or bearish price action. c) Whale & Institutional Activity Accumulation Phase: If whales are accumulating $IMT, it suggests confidence in a future price surge. Dumping & Sell-offs: If large holders start selling, it could lead to a sharp correction. 💡 Verdict: If sentiment remains strong and whales accumulate, expect a bullish move. If FUD increases and large sell-offs occur, a correction may follow. 3. Macroeconomic & Crypto Market Influence a) Bitcoin & Ethereum Trends Bitcoin Dominance: If BTC is bullish, altcoins like $IMT typically follow. Ethereum & DeFi Growth: If the DeFi sector expands, $IMT’s use case could strengthen, pushing prices higher. b) Global Market Conditions & Regulations Positive regulatory developments could boost investor confidence. Bearish macro conditions (inflation, interest rate hikes, or regulatory crackdowns) may lead to a risk-off sentiment in crypto. 💡 Verdict: If the overall crypto market remains bullish, $IMT could see higher highs. However, if macroeconomic factors turn bearish, a correction is more likely. 4. Bullish vs. Bearish Scenarios for $IMT’s Next Move 🚀 Bullish Scenario (Breakout Above Resistance) ✅ $IMT breaks resistance with strong volume and moves into price discovery. ✅ Whale accumulation, increased liquidity, and positive sentiment drive demand. ✅ Bitcoin and altcoin season push $IMT higher. 🔹 Target Price: If a bullish breakout occurs, $IMT could rally 50%–100% from its breakout zone. 📉 Bearish Scenario (Correction & Consolidation) ❌ $IMT fails to break resistance and faces profit-taking from early buyers. ❌ Whales start dumping tokens, causing a cascade of sell-offs. ❌ Crypto market sentiment turns bearish, impacting all altcoins. 🔹 Target Price: A correction could see $IMT drop 20%–40% before finding new support. Final Verdict: What’s Next for $IMT? 🔹 If $IMT holds support and breaks resistance, a bullish breakout is likely. 🔹 If trading volume declines and whales sell, a correction is expected. 🔥 Pro Tips for Traders: Monitor RSI & Moving Averages to spot potential breakout or correction signals. Watch Whale Movements for signs of accumulation or sell-offs. Stay Updated on News & Partnerships to anticipate major price moves. Use Stop-Loss Orders to minimize risk during volatile price swings.
BTC-0.01%
MOVE+3.28%
Wu Blockchain
Wu Blockchain
7h
First Digital: In response to FUD, FDUSD has completed its first batch of redemption requests, with the corresponding burn transactions verifiable on-chain. The official statement reaffirms that FDUSD continues to maintain a 1:1 full backing, and the redemption channel is
FDUSD0.00%
FUD-2.81%
ZhangWeicrypto
ZhangWeicrypto
18h
🌟🧐The partnerships shaping Bitcoin's future are diverse and multifaceted.🪴
The partnerships shaping Bitcoin's future are diverse and multifaceted. While I couldn't find specific information on current partnerships, several key factors are influencing Bitcoin's trajectory. Market Influencers - *Institutional Investment*: Growing interest from institutional investors, such as MicroStrategy, BlackRock, and Fidelity, is driving adoption and price fluctuations. - *Regulatory Developments*: Governments and financial watchdogs' regulatory actions significantly impact Bitcoin's price and adoption ¹ ². Technological Advancements - *Blockchain Upgrades*: Improvements to the underlying blockchain technology enhance market sentiment and investor confidence. - *Scalability Solutions*: Implementation of scalability solutions increases adoption and drives prices up ¹. Global Economic Trends - *Economic Uncertainty*: Times of uncertainty, like the pandemic or geopolitical tensions, make Bitcoin a perceived safe-haven asset, driving price fluctuations. - *Inflation Hedge Narrative*: Bitcoin's limited supply and growing demand contribute to its price volatility ³ ². Social and Market Sentiment - *Market Sentiment*: Investor emotions, such as fear, uncertainty, and doubt (FUD), trigger panic selling, while positive sentiment drives buying pressure. - *Social Media Influence*: News articles, analysis, and opinion pieces shape public perception and drive market sentiment ⁴ ⁵. To stay updated on the latest Bitcoin partnerships and developments, consider following reputable sources like (link unavailable), River, and OneSafe Blog ¹ ⁶ ³.$BTC
LINK-1.85%
BTC-0.01%
vinegar_angel
vinegar_angel
23h
"BANANAS31/USDT: Fundamental Analysis, Price Potential, and Market Outlook – Hold or Sell?"
**Current Price Overview** As of the latest data (verify via trusted tracking platforms like CoinGecko or CoinMarketCap for real-time updates), $BANANAS31 /USDT is trading at **[Insert Current Price Here]**. Always confirm the price independently before making decisions, as volatility in niche tokens can lead to rapid fluctuations. --- **Fundamental Analysis: Bullish or Bearish?** $BANANAS31 is a meme-inspired token, a category known for high volatility and community-driven momentum. Here’s a breakdown of key factors influencing its outlook: 1. **Project Utility and Roadmap** - If the project has a clear roadmap (e.g., upcoming partnerships, platform integrations, or utility expansions like NFT tie-ins), this could signal bullish momentum. Check the **official BANANAS31 website** for updates on development progress. - Lack of tangible utility or delayed milestones may reinforce bearish risks. 2. **Community Sentiment** - Strong social media engagement (Twitter, Telegram) often fuels meme token rallies. Monitor activity for spikes in mentions, holder growth, or influencer endorsements. - Declining engagement or “pump-and-dump” chatter could indicate bearish trends. 3. **Tokenomics** - Low circulating supply with high burns or staking rewards may support price stability. - Large wallets (whales) holding significant portions of the supply could lead to volatility. 4. **Market Trends** - Meme tokens often mirror broader crypto market sentiment. A bullish Bitcoin or Ethereum rally could lift BANANAS31. - Regulatory scrutiny or bearish macro conditions may pressure speculative assets. --- **Price Potential: How High Could $BANANAS31 Go?** Based on fundamentals and historical meme token cycles: - **Bullish Scenario**: If the project announces major updates (e.g., exchange listings, viral marketing), BANANAS31 could see short-term gains of **20–50%** or more, depending on hype. - **Bearish Scenario**: Failure to sustain community interest or market downturns might trigger sharp corrections, erasing 30–60% of value. --- **Hold or Sell? Key Considerations** - **Hold If**: - The team delivers on roadmap promises (check their website for verifiable progress). - Community metrics (holders, social volume) are rising steadily. - The broader crypto market is in an uptrend. - **Sell If**: - The token lacks development traction or faces FUD (Fear, Uncertainty, Doubt). - You’ve hit profit targets or risk tolerance thresholds. --- **Final Thoughts** $BANANAS31 ’s fate hinges on its ability to evolve beyond meme status. While short-term pumps are possible, long-term viability requires utility and execution. Always prioritize risk management: never invest more than you can afford to lose. **Verify Critical Data**: Cross-reference prices, team updates, and social sentiment from trusted platforms before acting.
HOLD0.00%
FUD-2.81%

Related assets

Popular cryptocurrencies
A selection of the top 8 cryptocurrencies by market cap.
Comparable market cap
Among all Bitget assets, these 8 are the closest to FTX Users' Debt in market cap.