SPX6900 (SPX) Holds Key Support After Major Decline – Will This Pattern Spark a Recovery?

Date: Sat, March 15, 2025 | 11:10 AM GMT
The crypto market is showing mild signs of recovery, with Bitcoin (BTC) bouncing back from its weekly low of $76K to its current level around $84K. After enduring a steep decline since the late 2024 highs, major memecoins took a sharp hit, including SPX6900 (SPX), which has dropped by a massive 63% over the last 60 days.
However, as the market stabilizes, SPX has gained over 8% today, and the price action suggests that a bullish reversal could be underway, helping it stage a potential recovery.
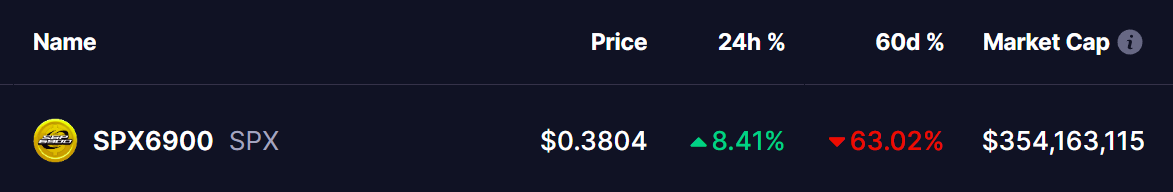 Source: Coinmarketcap
Ascending Broadening Wedge Setup
SPX’s weekly chart highlights a classic ascending broadening wedge pattern, which is generally considered a bearish formation. However, there is still room for an upside move before any potential breakdown. The latest correction began after rejection from the upper trendline at $1.77 (All-Time High) on January 20, triggering a sharp decline toward the lower support trendline.
With this drop, SPX tested the lower trendline support at $0.25 and has since managed to bounce slightly, now trading around $0.38. If SPX follows this pattern, a strong recovery could be anticipated, with the next key resistance being its 50-day moving average (MA) at $0.50.
A clear move above this level could confirm an uptrend, potentially pushing SPX towards the $1.38 resistance and eventually retesting its all-time high of $1.77.
However, if SPX fails to break key resistances, the bearish nature of the wedge could come into play, leading to a potential breakdown below support levels.
The MACD indicator is currently in a negative zone but is showing signs of a potential bullish crossover. If momentum shifts in favor of buyers, it could further confirm a trend reversal in the coming weeks.
Final Thoughts
SPX6900 is currently at a critical decision point. While the ascending broadening wedge suggests a recovery, the key confirmation of an uptrend will only come if SPX reclaims its 50-day moving average (50D MA). A break and close above this level could signal further upside towards $1.38 and potentially its all-time high of $1.77.
However, failure to hold the current support trendline could invalidate the pattern, leading to a bearish breakdown. In such a scenario, SPX might retest lower levels, possibly dipping below $0.090.
Disclaimer: This article is for informational purposes only and not financial advice. Always conduct your own research before investing in cryptocurrencies.
Disclaimer: The content of this article solely reflects the author's opinion and does not represent the platform in any capacity. This article is not intended to serve as a reference for making investment decisions.
You may also like
XRP Bounces from Key Support – But Familiar Fractal Raises Bearish Concerns

$2T fake tariff news pump shows ‘market is ready to ape’
Markets rallied after mainstream media outlets shared a fake news story about a three-month tariff pause, and some say this is a good sign.

In the last 48 hours, the Musk-themed meme coin RFC surged by 200%. Could RFC become the next DOGE?
In 35 days, there were 22 interactions. Musk really «loves» this meme concept, doesn't he?

U.S. Tariff Truce Fiasco: BTC Flash Crashes Below $81K, May Rate Cut Expectation Soars
A Trump slip of the tongue upends the global market, with Bitcoin surging and then falling, US stocks experiencing huge volatility, and Fed rate cut expectations gaining momentum.